N.B THE DATASET USED IS ENTIRELY FICTIONAL & HAS BEEN GENERATED FOR DEMONSTRATION, TESTING OR EDUCATIONAL PURPOSES. ANY RESEMBLANCE TO ACTUAL COMPANIES, ORGANIZATIONS IS PURELY COINCIDENTAL
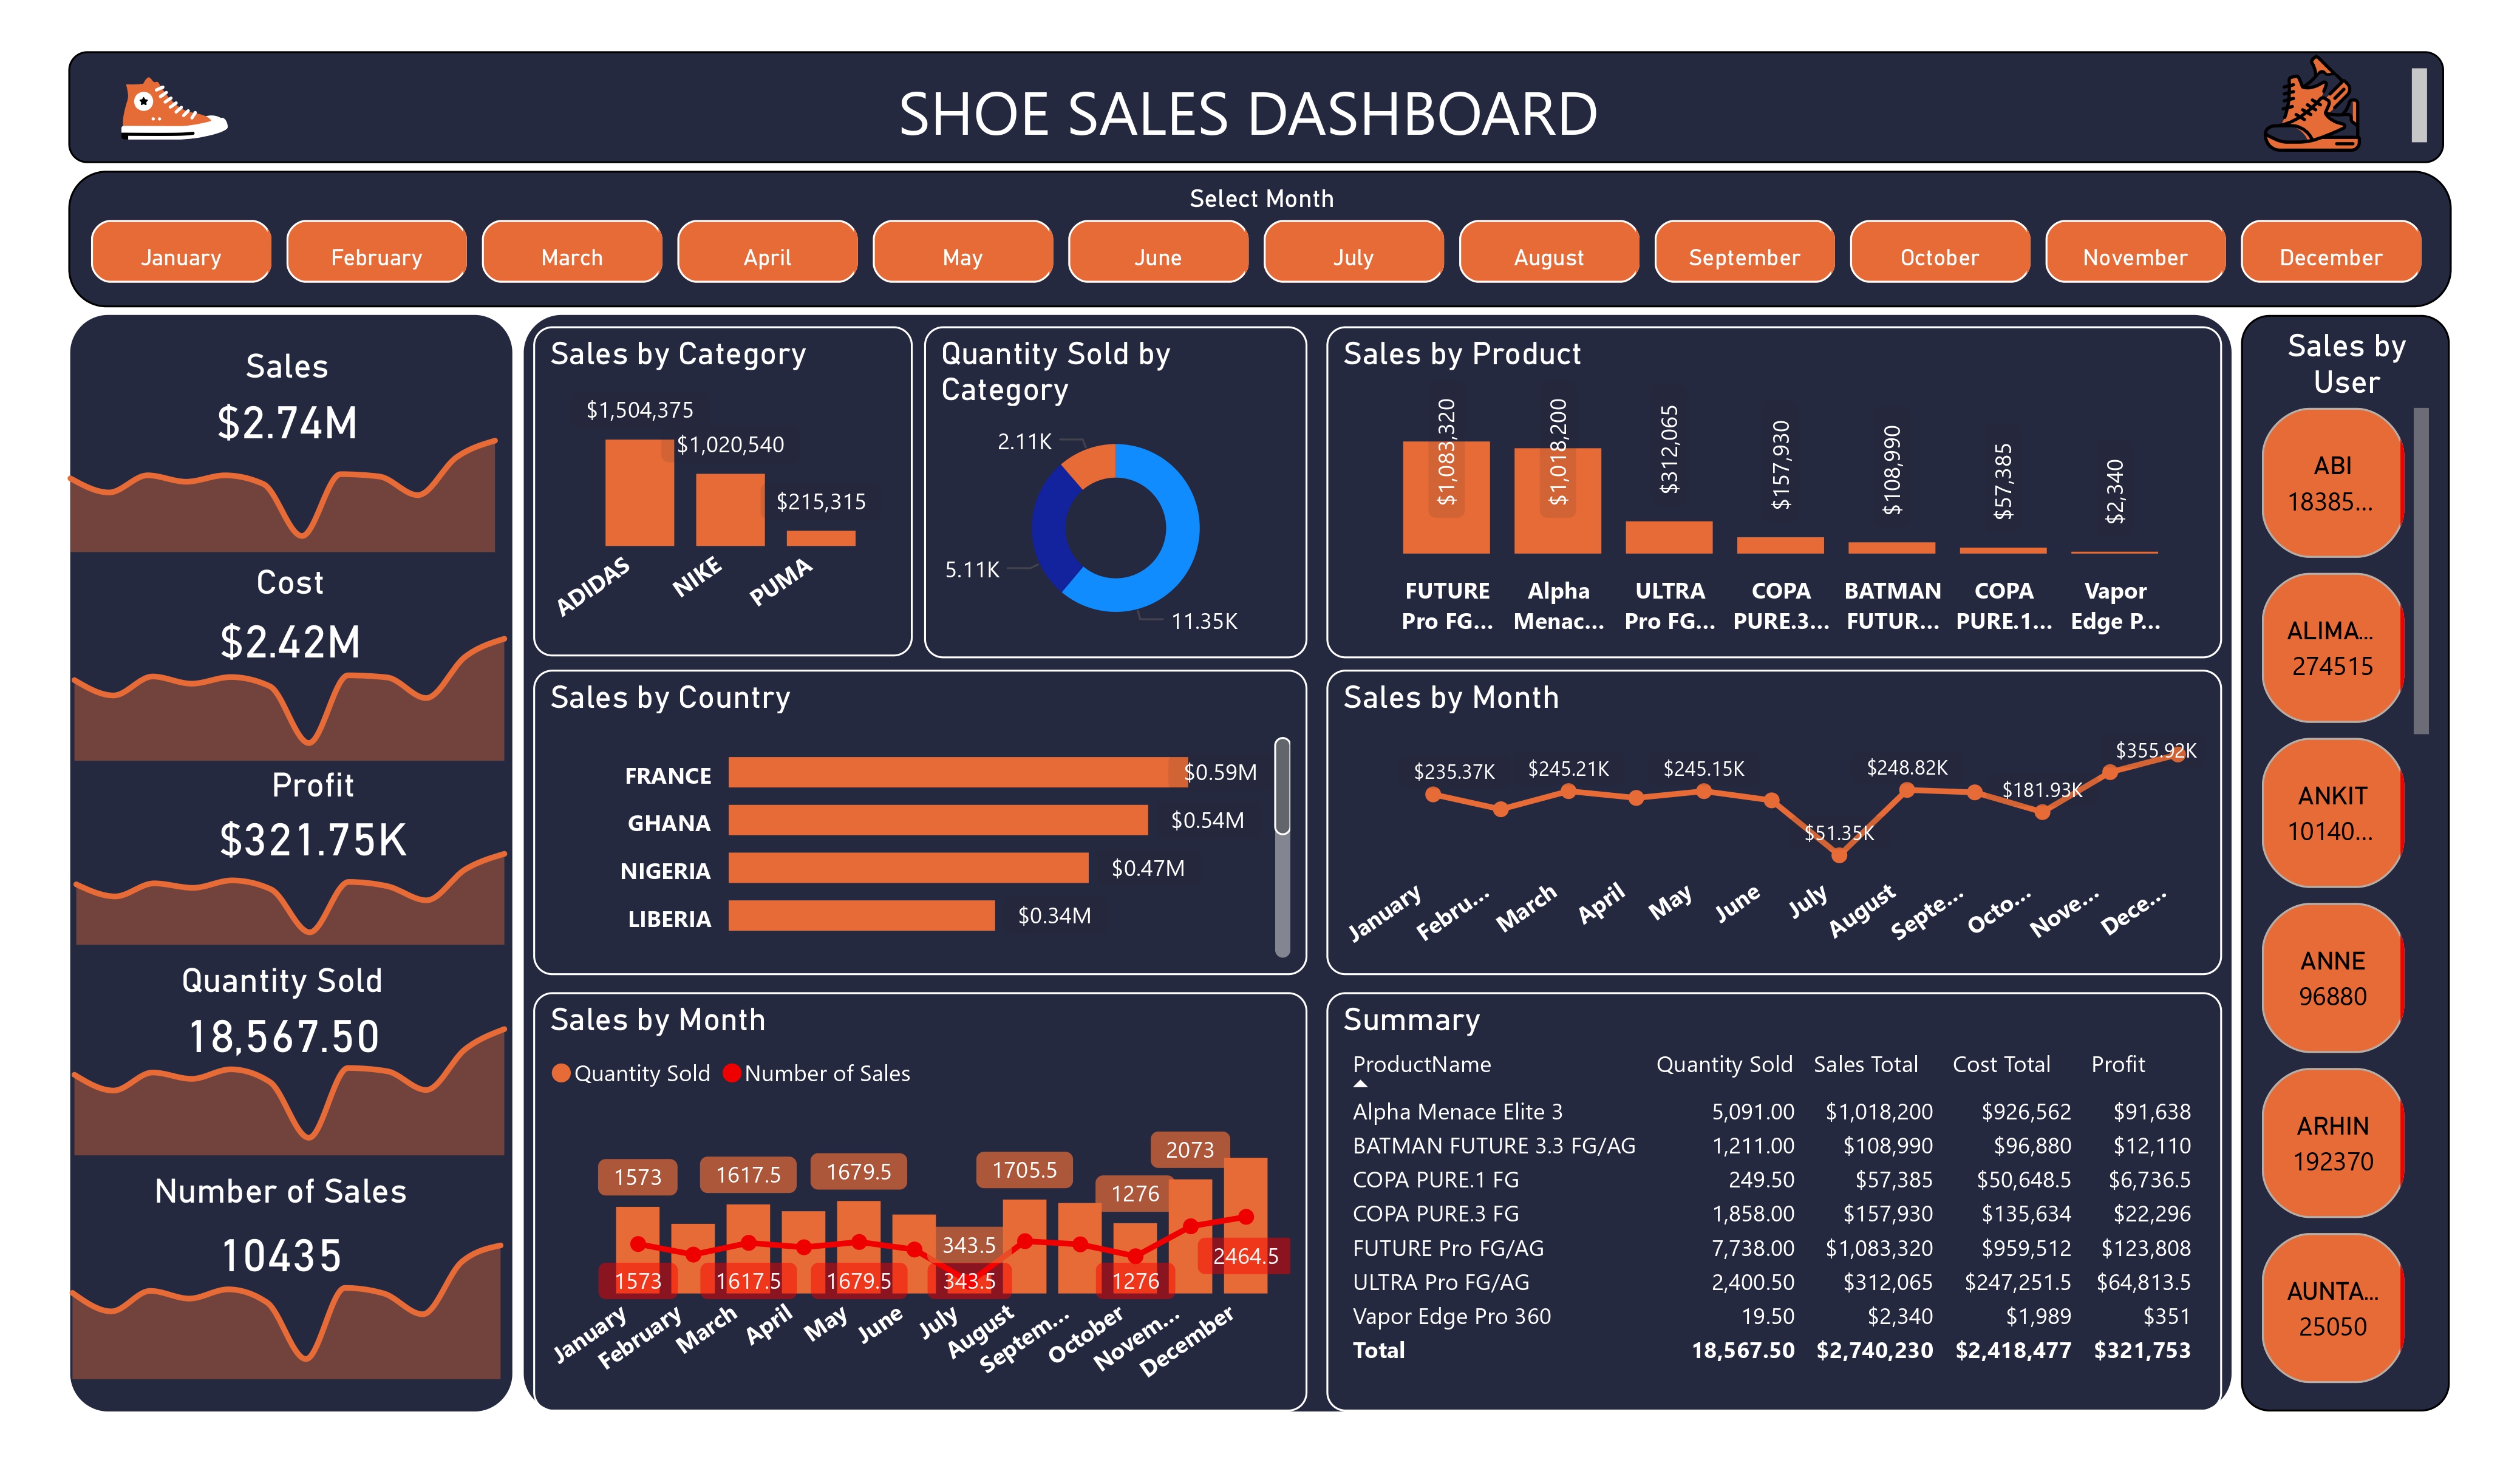
The Overall Dashboard: Key Insights
Sales Performance: Total sales amount to $274M, with a cost of $242M.
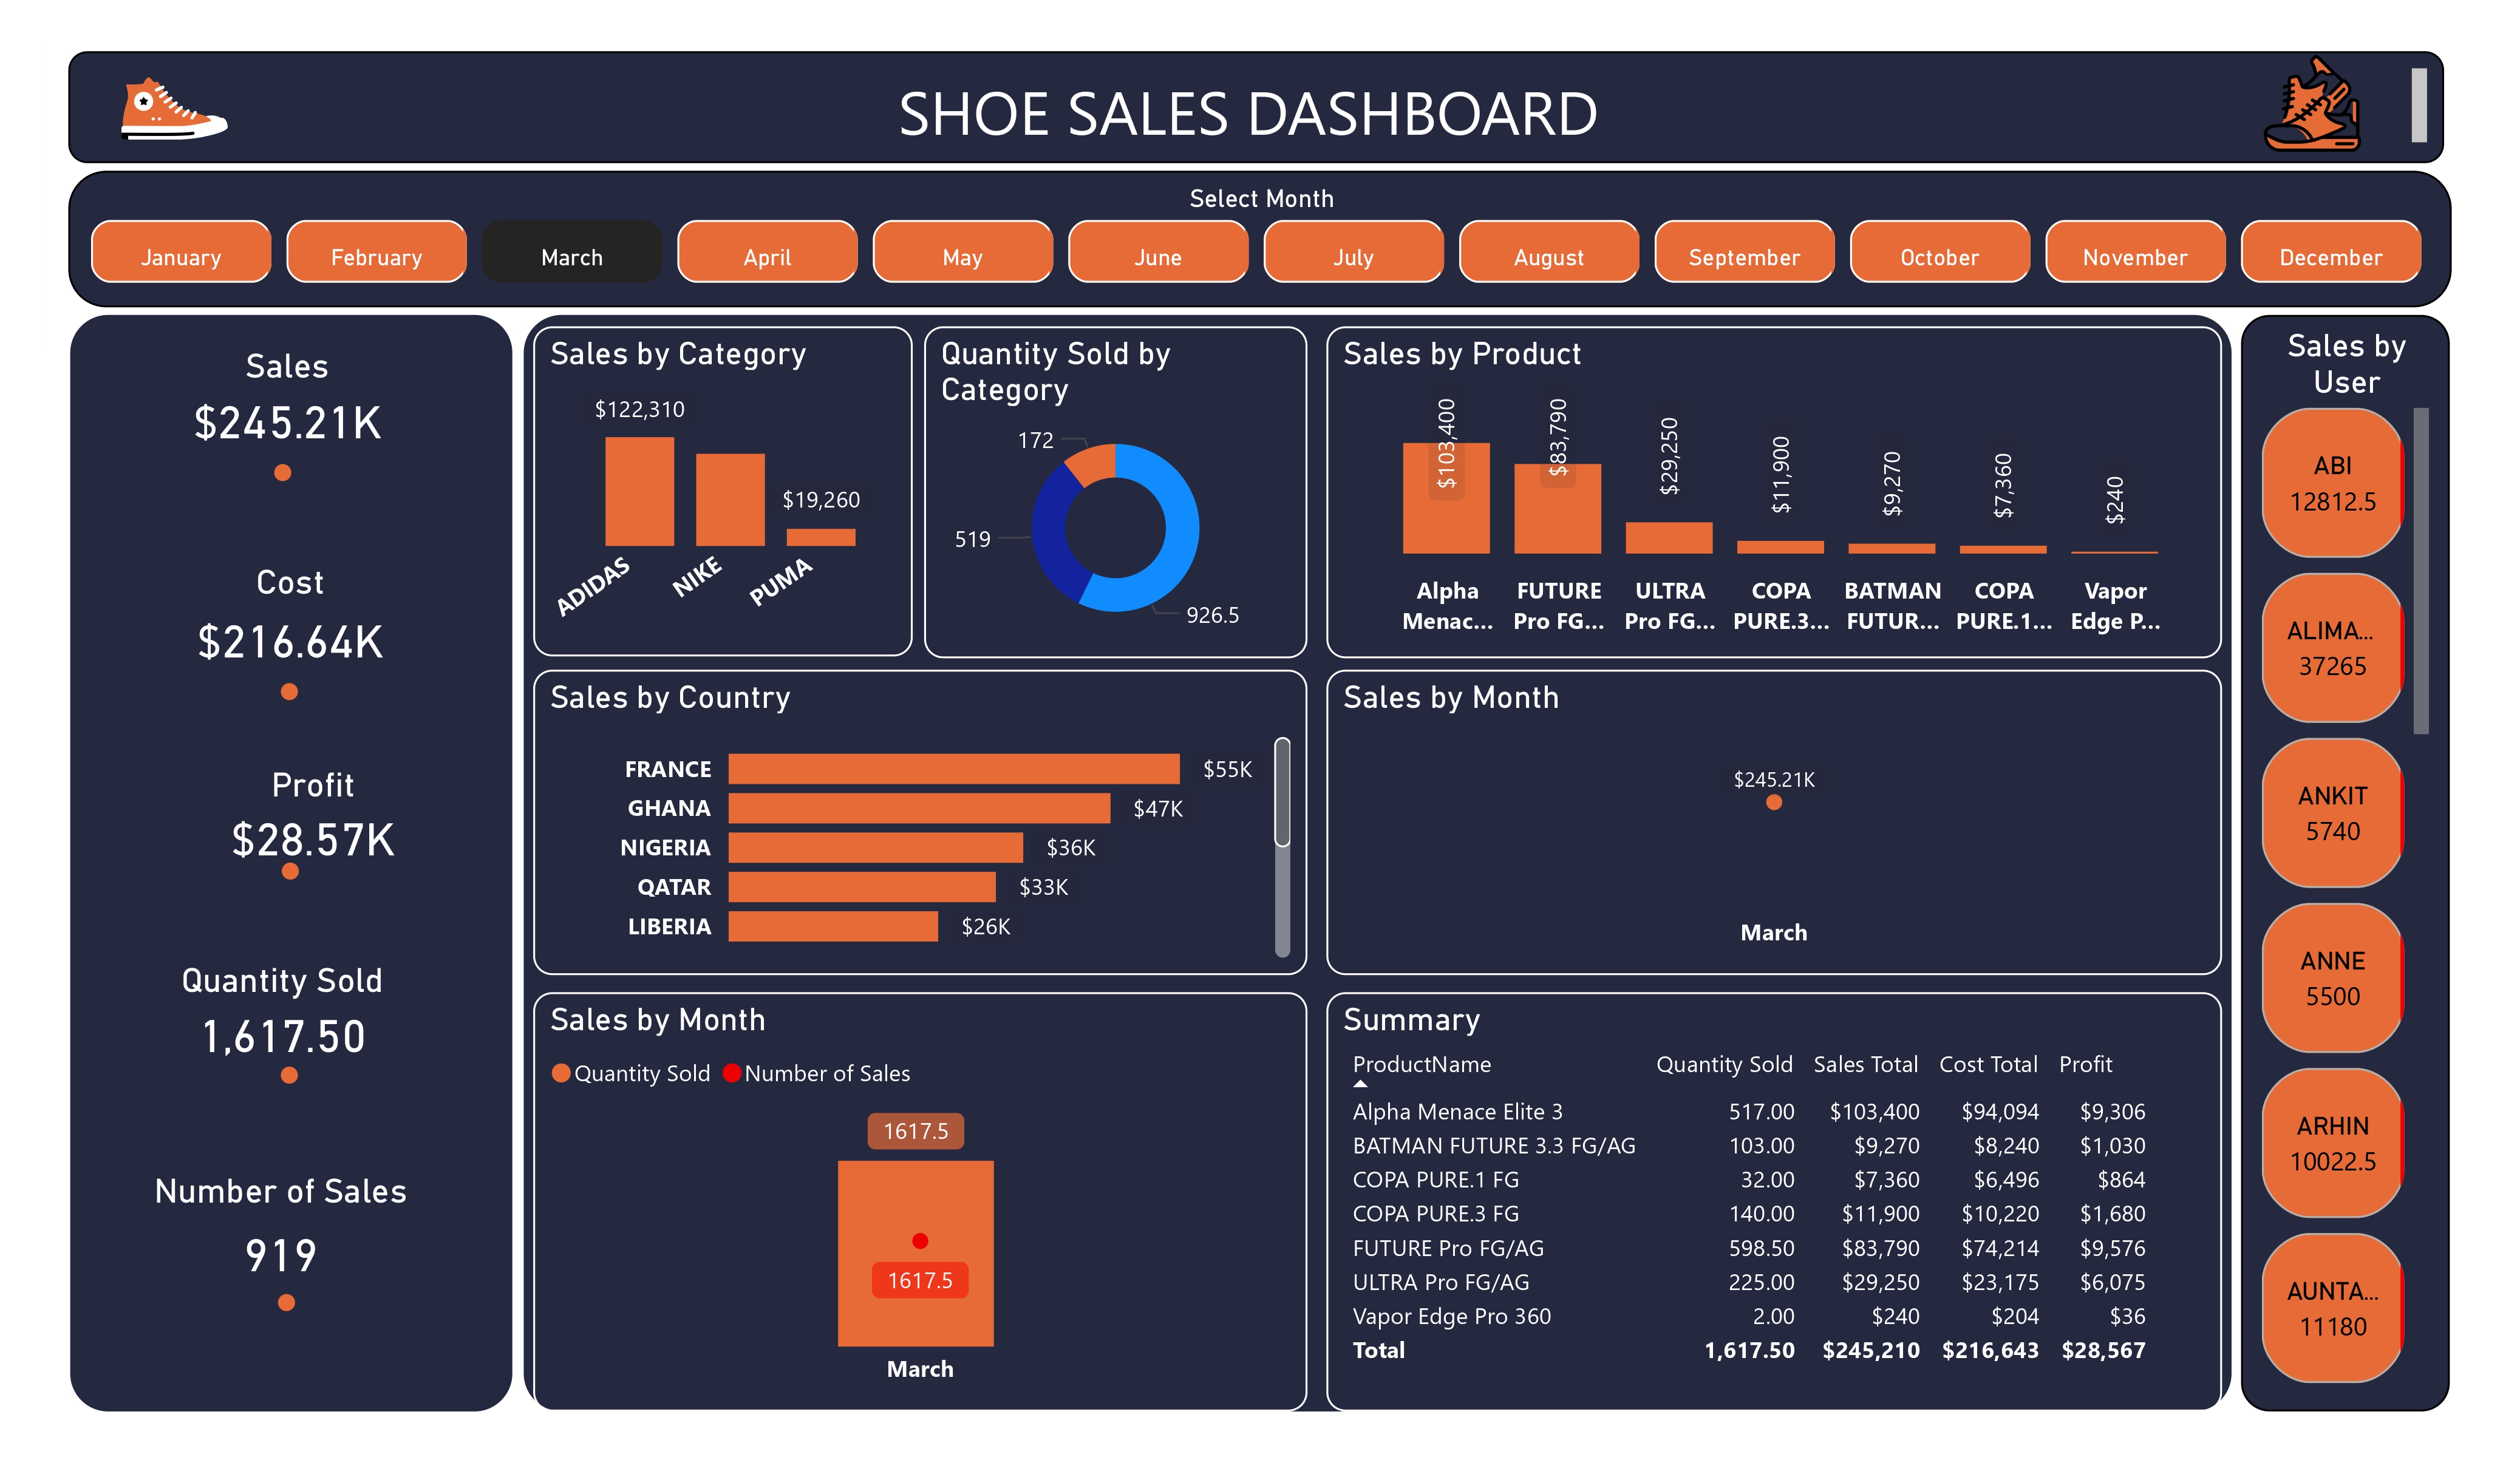
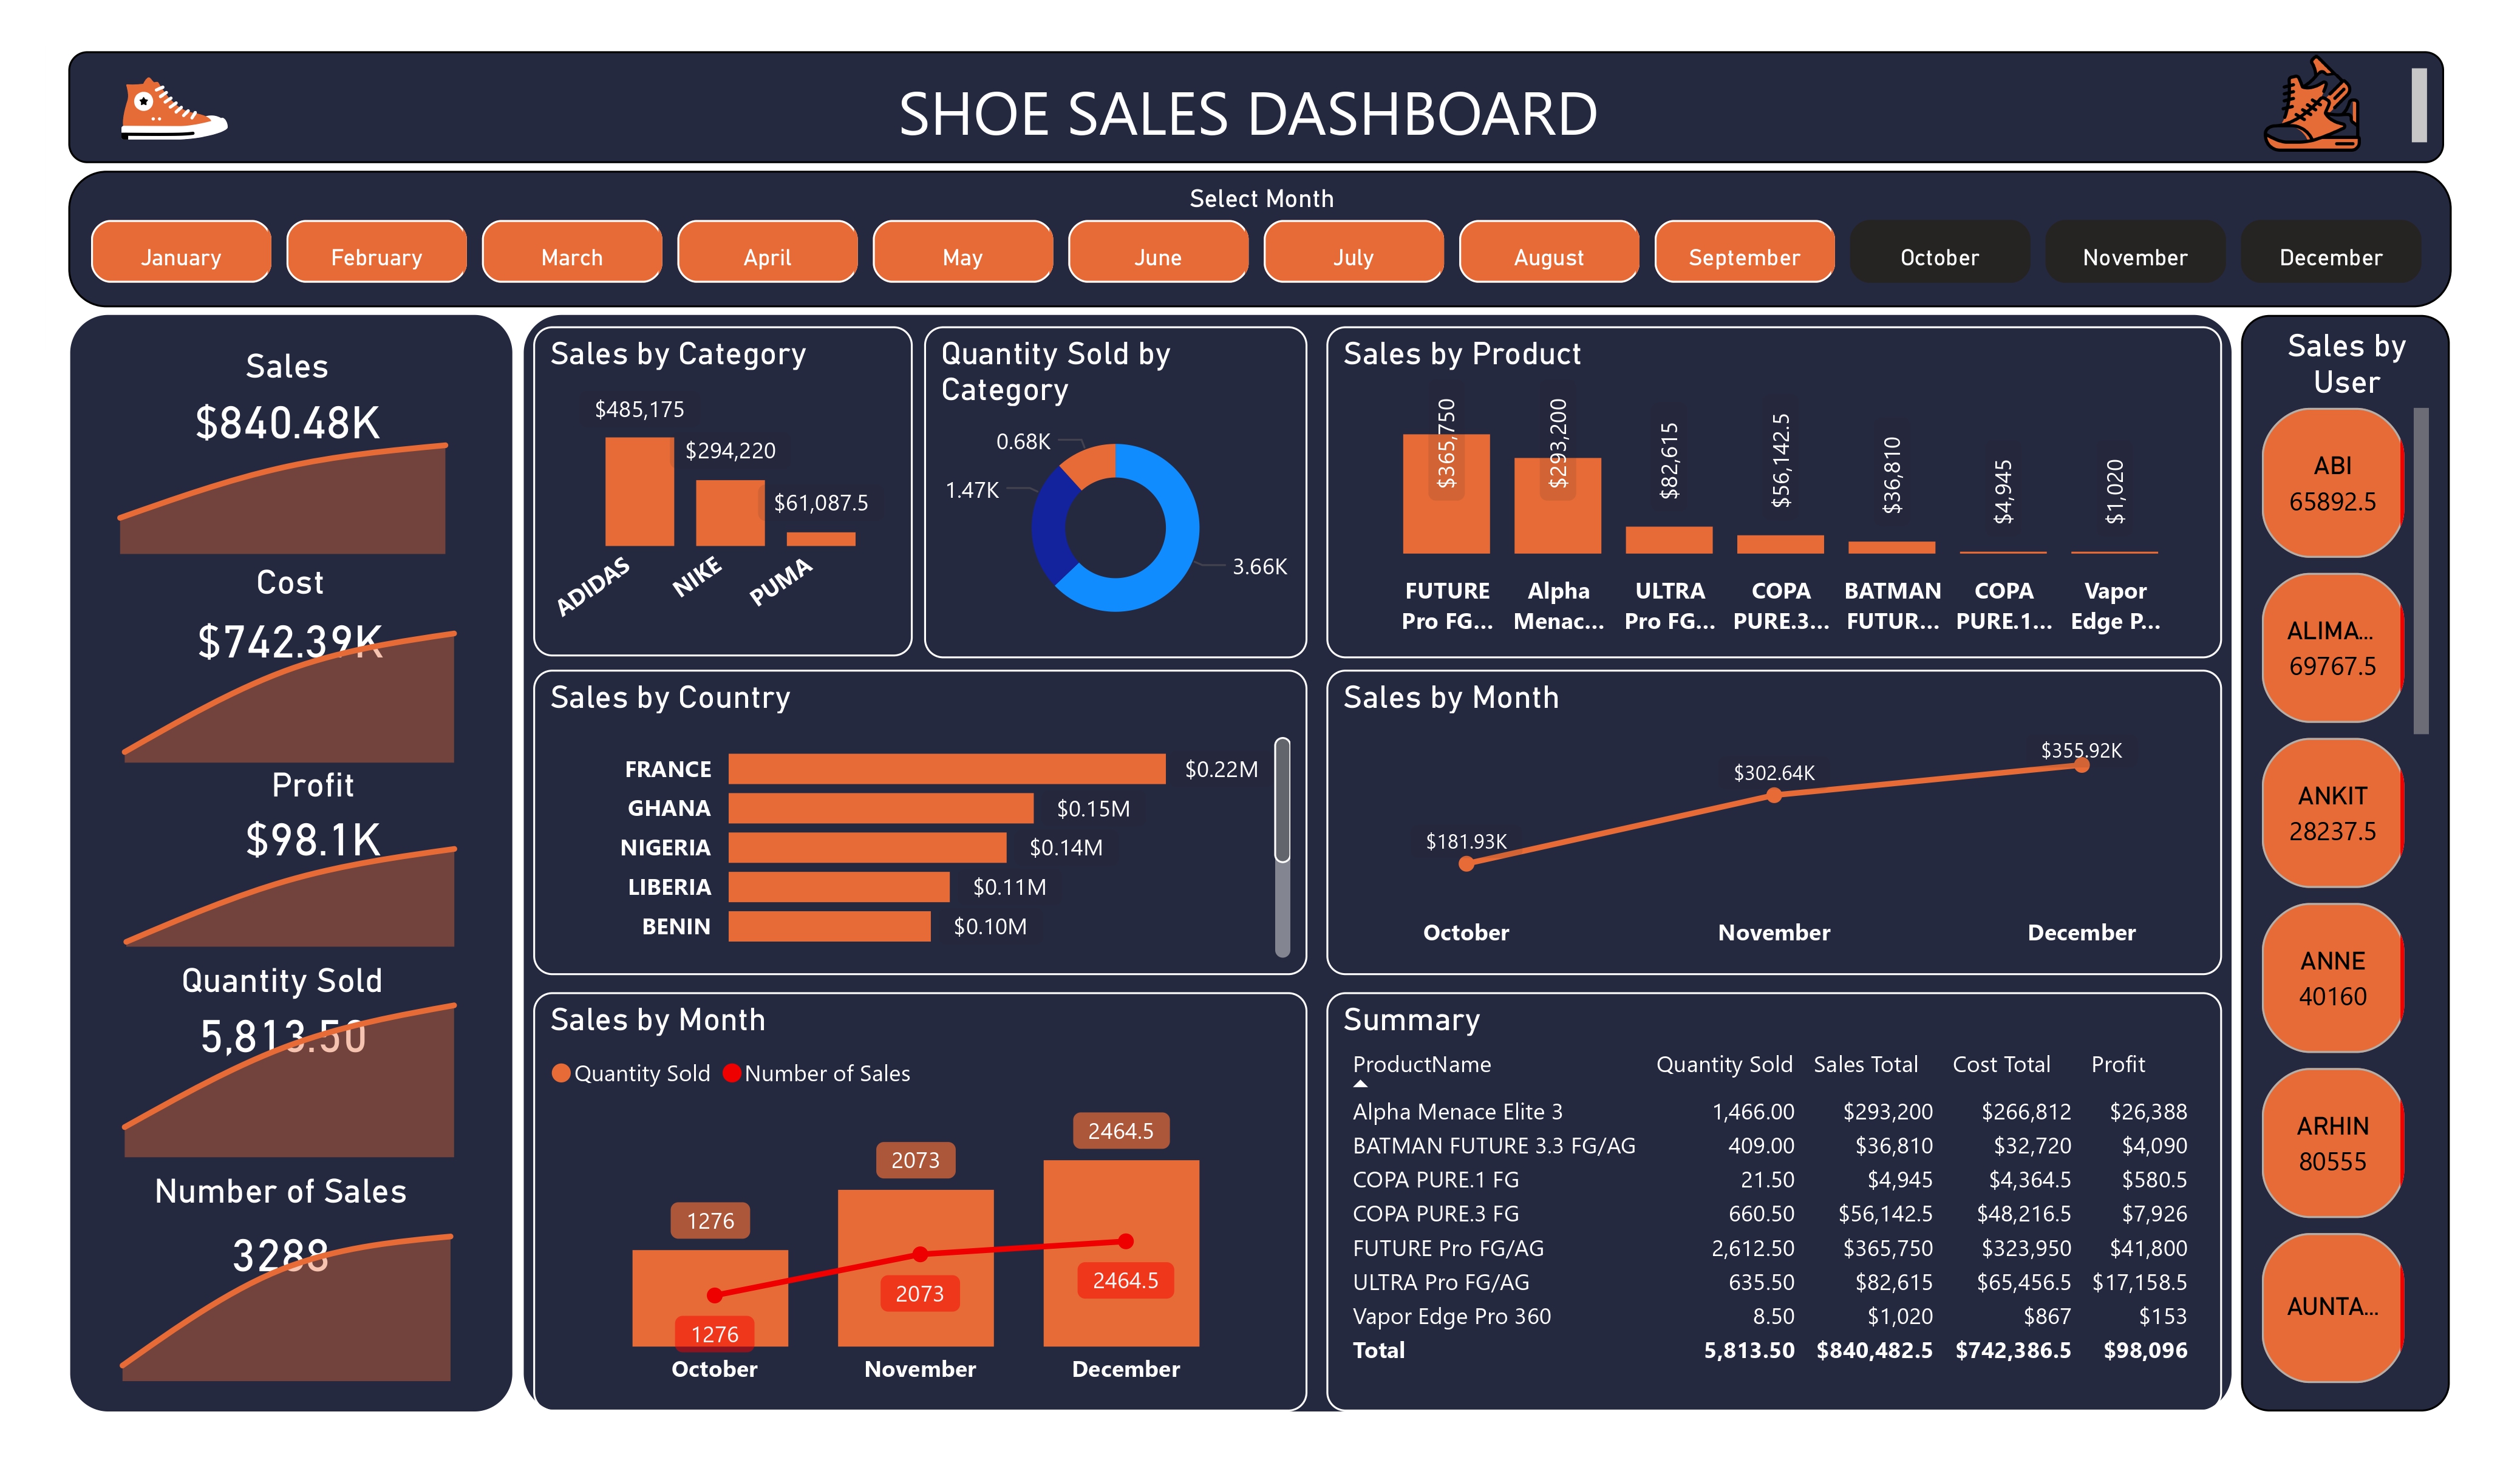
Monthly Trends: The ability to select a month indicates ongoing tracking of sales performance, allowing for identification of seasonal trends.
Category Insights: The “Sales by Category” section shows a breakdown of sales across different categories, which can highlight which categories are underperforming or excelling.
Product Popularity: The “Sales by Product” section provides insights into specific shoe models, indicating which products are driving sales. It appears that certain models are significantly more popular than others.
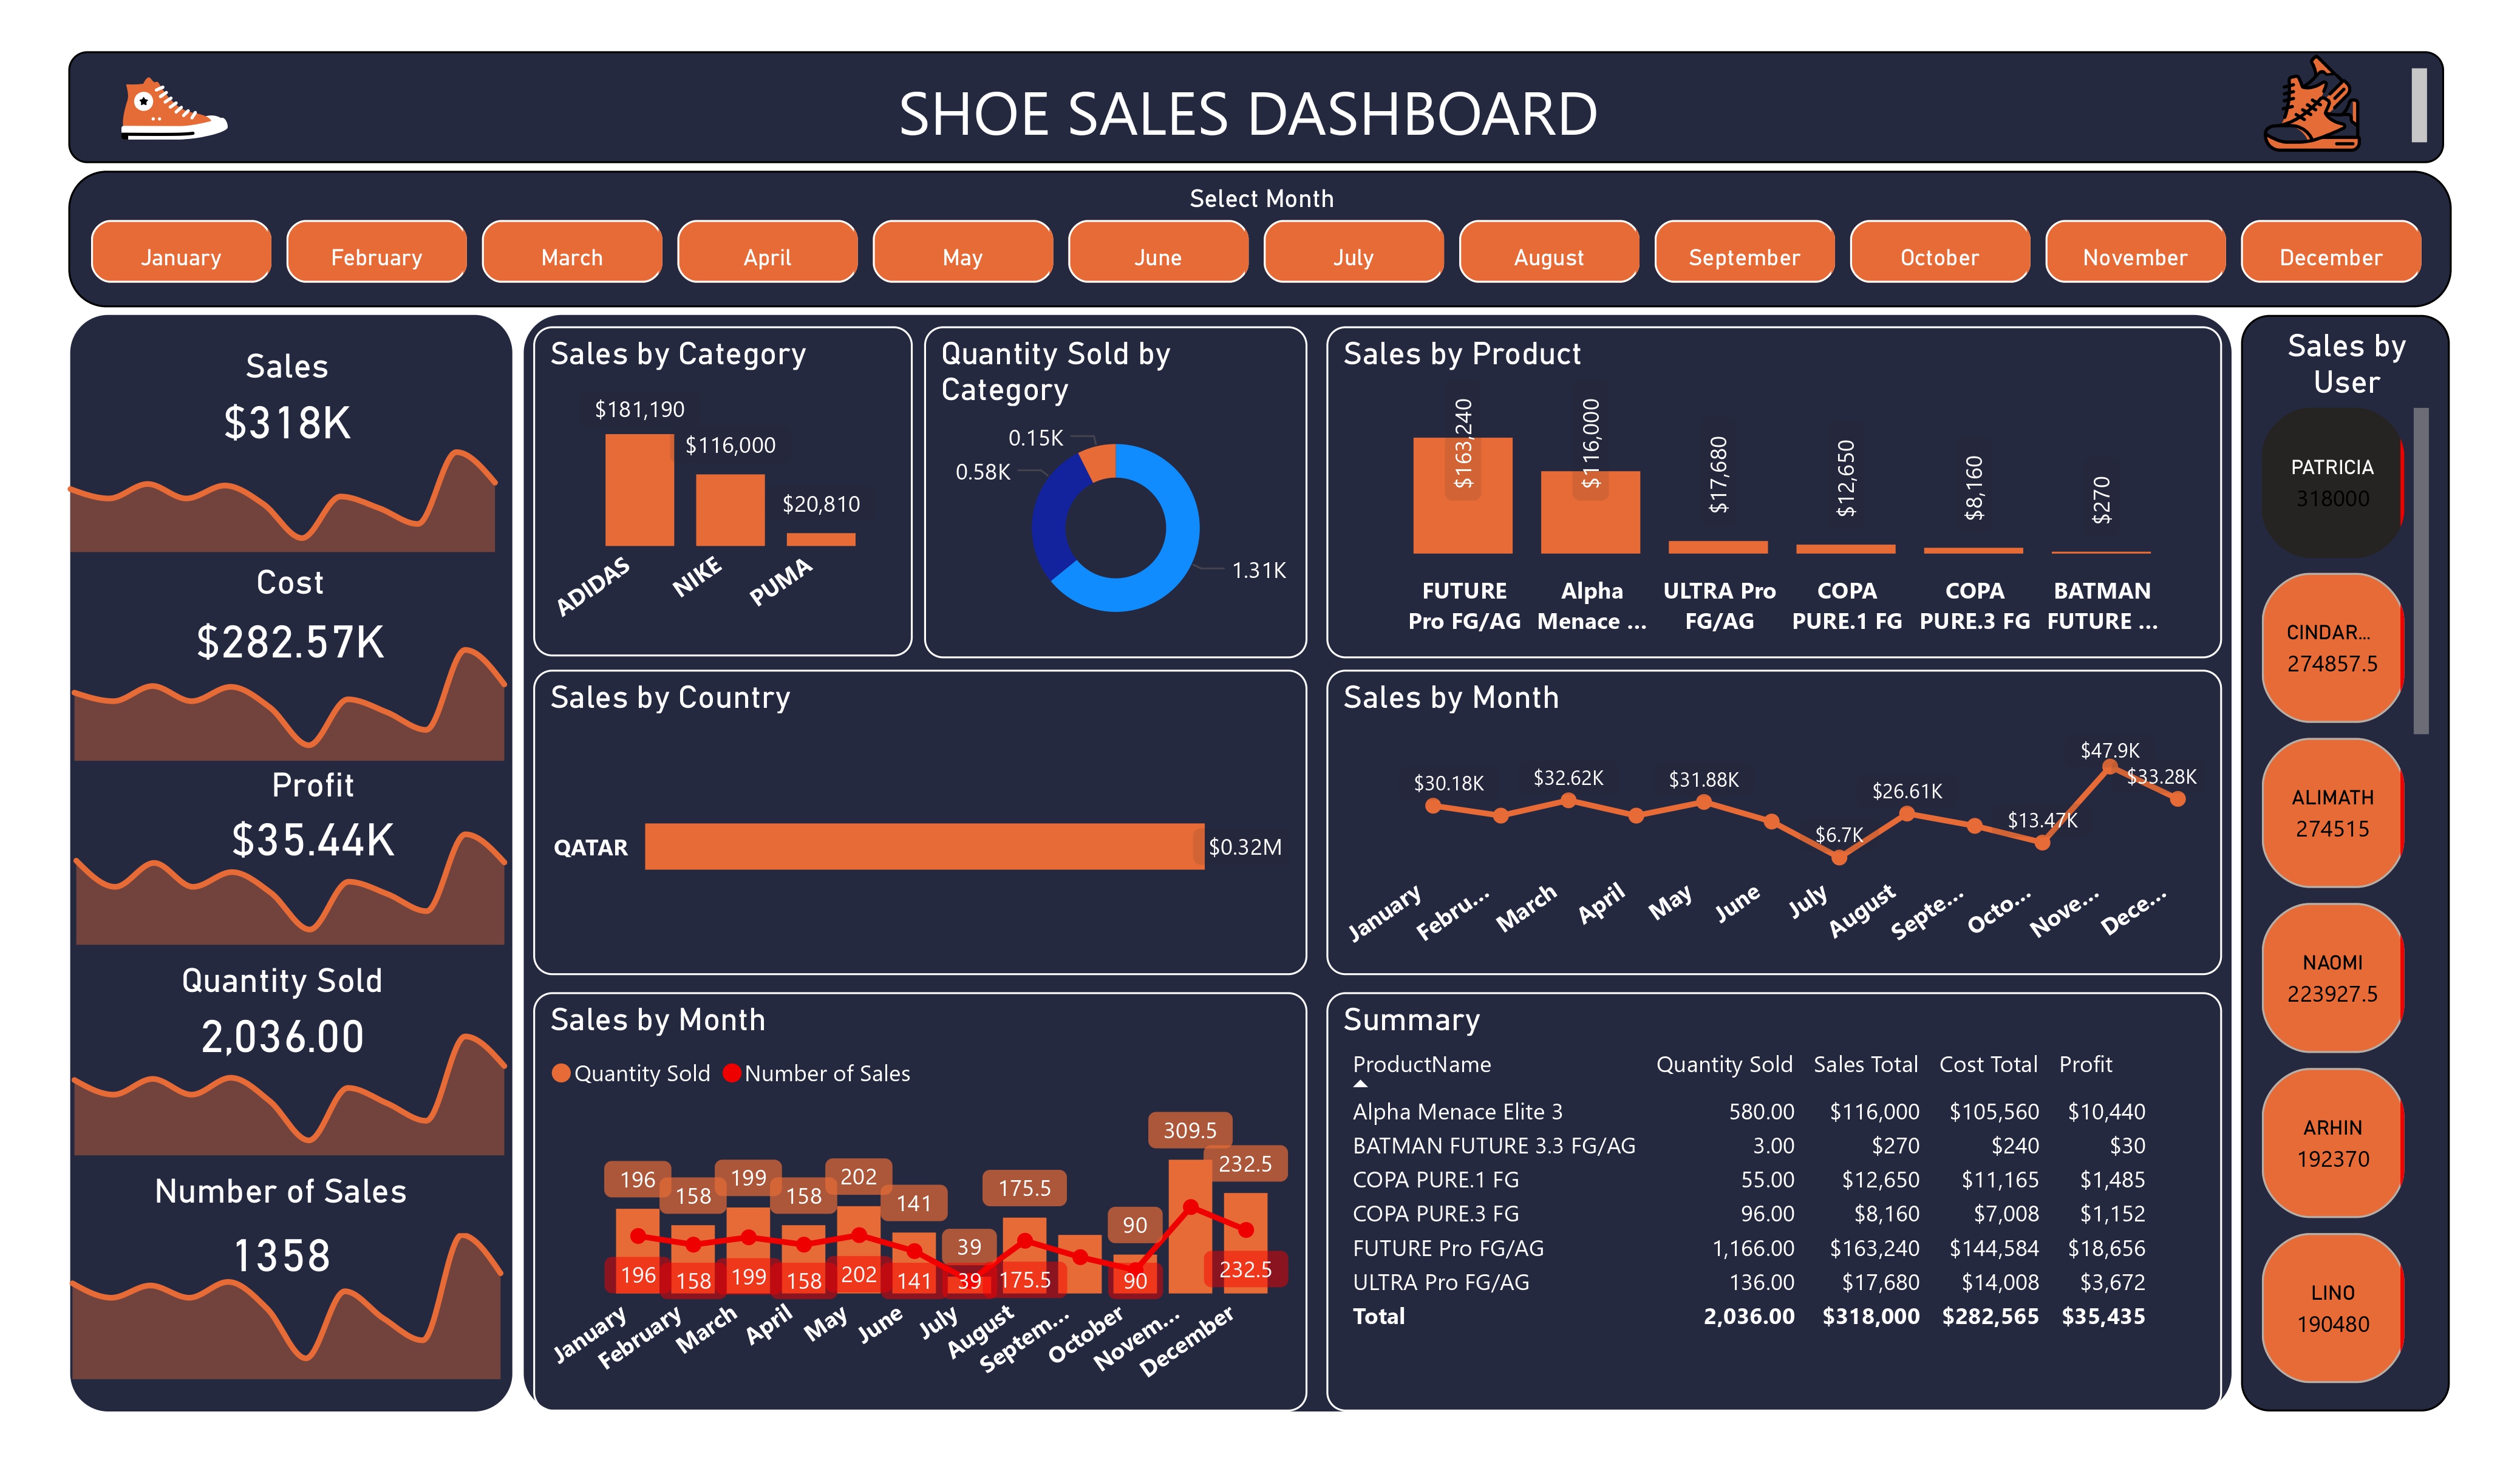
Geographic Distribution: Sales by country indicate that France is a leading market, followed by Germany, Nigeria, and Liberia. This information can guide targeted marketing efforts in these regions.
Sales Volume: With 10,435 units sold, the average sale price can be estimated, which may help assess pricing strategies and identify potential areas for discounting.
User Engagement: The “Sales by User” section tracks the performance of individual sales representatives, which can help assess team performance and identify top performers.
Summary Table: The summary section provides key metrics, allowing for quick insights into total sales, quantity sold, and total cost, which are crucial for evaluating overall performance.